To check the PageSpeed score of a WordPress site, enter its address at Google’s PageSpeed Insights (pagespeed.web.dev) and read the mobile and desktop results. To see the score inside WordPress itself, install a plugin that runs the same Google test from your dashboard, such as Site Kit by Google or SwiftWebDev Dashboard & Analytics. Either way the test needs a public website address, so it won’t work on a site that only runs on your computer.
I check speed scores on every WordPress site I build or fix, usually before and after each change. This guide shows four ways to run the test, how to read the result, and why your score can jump around between runs.
Method 1: Google PageSpeed Insights in your browser
This is the official tool and the one every other method is based on. It’s free and needs no account.
- Open pagespeed.web.dev.
- Paste the full address of the page you want to test, for example your homepage, and choose Analyze.
- Wait for the test to finish. It usually takes under a minute.
- Switch between the Mobile and Desktop tabs at the top. They’re two separate tests with separate scores.
Test the pages that matter most, not only the homepage. A blog post with a large featured image or a shop page with many products often scores lower than the homepage.
Method 2: Lighthouse in Chrome DevTools
PageSpeed Insights runs Google’s Lighthouse tool on Google’s servers. Chrome has the same tool built in, which is handy for pages that aren’t public yet or for quick checks while you work.
- Open the page in Chrome and press F12 (or right-click and choose Inspect).
- Open the Lighthouse tab. If you can’t see it, it’s under the » menu.
- Choose Mobile or Desktop, tick Performance, and run the analysis.
Run it in an Incognito window so browser extensions don’t slow the page down and lower the score. Your own computer and connection also affect the result, so expect it to differ a little from PageSpeed Insights.
Method 3: See your PageSpeed score in the WordPress dashboard
If you check often, it’s easier to see the score where you already work. A plugin can run the PageSpeed Insights test for you and show the result in the WordPress admin.
Site Kit by Google
Site Kit is Google’s official WordPress plugin, with more than 5 million active installs according to its WordPress.org listing. Its PageSpeed Insights module shows speed results in the Site Kit dashboard. It’s a good choice if you already use Google Analytics and Search Console, because Site Kit connects all of them in one place. Setting it up means signing in with a Google account and connecting your site.
SwiftWebDev Dashboard
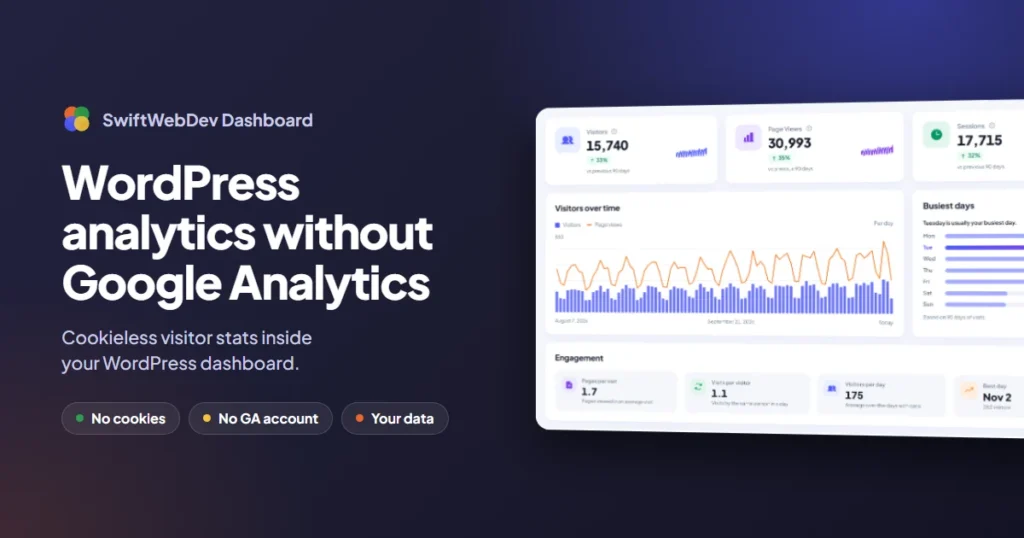
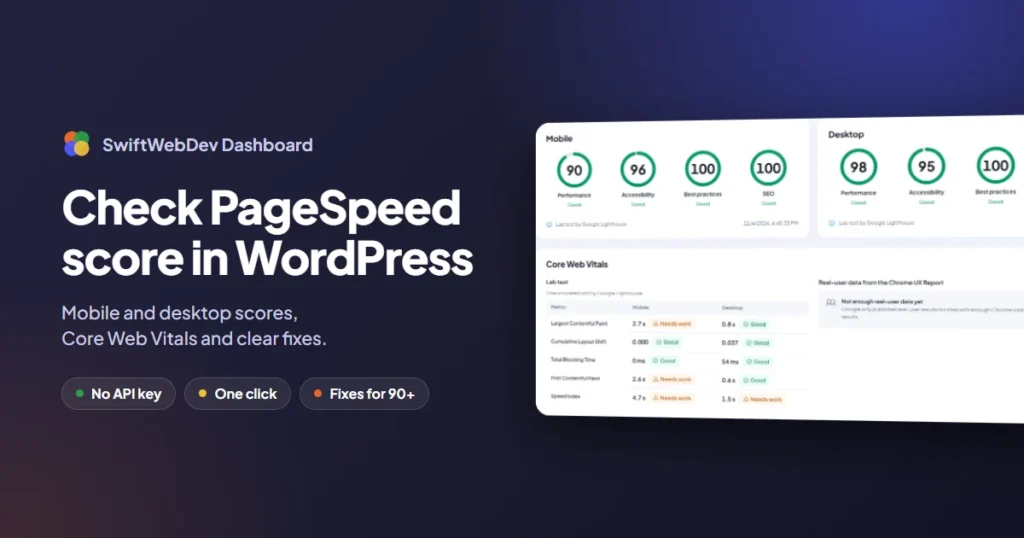
SwiftWebDev Dashboard is a free plugin I built that shows PageSpeed scores on its dashboard, next to cookieless visitor stats, pending updates and Site Health. Open Speed & Optimize under SwiftWebDev in the admin menu and choose Run test. It shows mobile and desktop scores for Performance, Accessibility, Best Practices and SEO, the Core Web Vitals from the test, real-user Chrome data when Google has it, and a ranked list of what to fix. You can test your homepage or any other page of your site. It needs no Google account or API key, because the test runs through the plugin’s own speed test service, and no visitor data is sent. The paid SwiftWebDev Dashboard PRO add-on adds scheduled weekly tests with a score history.
A note on older speed plugins
Search for a PageSpeed dashboard plugin and you’ll find some that haven’t been updated in a long time. One of the top results, PageSpeed Dashboard, was last updated in September 2024 and is marked as not tested with the latest three major WordPress releases. Check the “Last updated” date on WordPress.org before you install any plugin that talks to an outside service.
Method 4: Field data in Google Search Console
The three methods above run a lab test: one simulated visit to the page. Google Search Console shows something different, the field data from real Chrome users on your site.
Open Search Console, go to Core Web Vitals under Experience, and you’ll see which pages pass or fail for mobile and desktop visitors. This report only appears once your site has enough Chrome traffic for Google to publish the data, so new or small sites often see “Not enough data” for a while.
How to read your PageSpeed score
The big number is the Performance score, from 0 to 100. Google colors it in three bands, as described in the Lighthouse performance scoring guide:
| Score | Color | What it means |
|---|---|---|
| 90 to 100 | Green | Good |
| 50 to 89 | Orange | Needs improvement |
| 0 to 49 | Red | Poor |
The score is built from several timings measured during the test, such as how long the main content takes to appear (Largest Contentful Paint), how much the layout moves while loading (Cumulative Layout Shift) and how long the page is blocked by scripts (Total Blocking Time). The other three scores, Accessibility, Best Practices and SEO, are checklists rather than speed measurements.
Lab score versus real-user data
PageSpeed Insights shows both at once, which confuses a lot of people. The top section, about what your real users are experiencing, comes from the Chrome UX Report: real visits over the last 28 days. The lower section with the 0 to 100 score is the lab test. Google’s Core Web Vitals assessment uses the real-user data, not the lab score. A page can score 70 in the lab and still pass Core Web Vitals for real visitors, or the other way round.
Why your mobile score is lower than desktop
The mobile test simulates a mid-range phone on a slow mobile connection, with the processor slowed down on purpose. The desktop test uses a fast computer and connection. The same page has to do the same work on a much slower device, so a mobile score 20 or 30 points below desktop is normal. Most visitors to a typical site are on phones, so the mobile score is usually the one to watch.
Why your score changes every time you test
Run the same test twice and you’ll often get two different numbers. That’s expected. Server response time, ads and third-party scripts, the test server’s load and network conditions all vary a little between runs.
- Run the test two or three times and look at the typical result, not the best one.
- Compare mobile with mobile and desktop with desktop.
- Test again after each single change, so you know which change made the difference.
- Clear your caching plugin’s cache before testing a change, or you may be testing the old page.
What to do after you check your score
The score tells you how the page is doing. The list under it, called Diagnostics or opportunities, tells you why. Start with the items Google marks as having the biggest impact, which are usually oversized images, render-blocking CSS and JavaScript, and slow server response.
For the fixes themselves, read the guide to Core Web Vitals optimization in WordPress. If you’d rather have someone do it, Swift Web Dev offers a Core Web Vitals optimization service. That’s a separate service, not part of any plugin license.
Questions people ask about PageSpeed scores in WordPress
How do I check my WordPress site speed for free?
Use Google PageSpeed Insights at pagespeed.web.dev. Enter your page address, choose Analyze, and read the mobile and desktop scores. It is free and needs no account.
What is a good PageSpeed score for WordPress?
90 or above is good, 50 to 89 needs improvement and below 50 is poor. Aim for 90 on desktop and as close as you can get on mobile, and check that real-user Core Web Vitals pass.
Why does PageSpeed Insights not work on my local site?
Google runs the test from its own servers, so it can only reach websites on the public internet. Use Lighthouse in Chrome DevTools for a local site, then test with PageSpeed Insights once the site is online.
Does the PageSpeed score affect Google rankings?
Not directly. Google uses Core Web Vitals from real users as one of many ranking signals. The lab score is a diagnostic tool that helps you improve those real-user numbers.
Can I see PageSpeed scores in the WordPress dashboard?
Yes. Plugins such as Site Kit by Google and SwiftWebDev Dashboard run the PageSpeed Insights test and show the result in the WordPress admin, so you do not have to open another website.
To keep an eye on speed without leaving WordPress, try the free SwiftWebDev Dashboard plugin, available from WordPress.org. The plugin docs explain each score. It also shows cookieless visitor stats, which the guide to WordPress analytics without Google Analytics explains in more detail.